Observability
13.1 Introduction
For observability, the framework supports Application Performance Monitoring(APM) abd Business Performance Monitoring(BPM) out of the box. This includes distributed trace context propagation across sync and async channels, logging and basic metrics.
For the same, we are leveraging the OpenTelemetry standard and its supporting tech ecosystem.
Not even a single request must go untracked!
13.1.1 Architecture
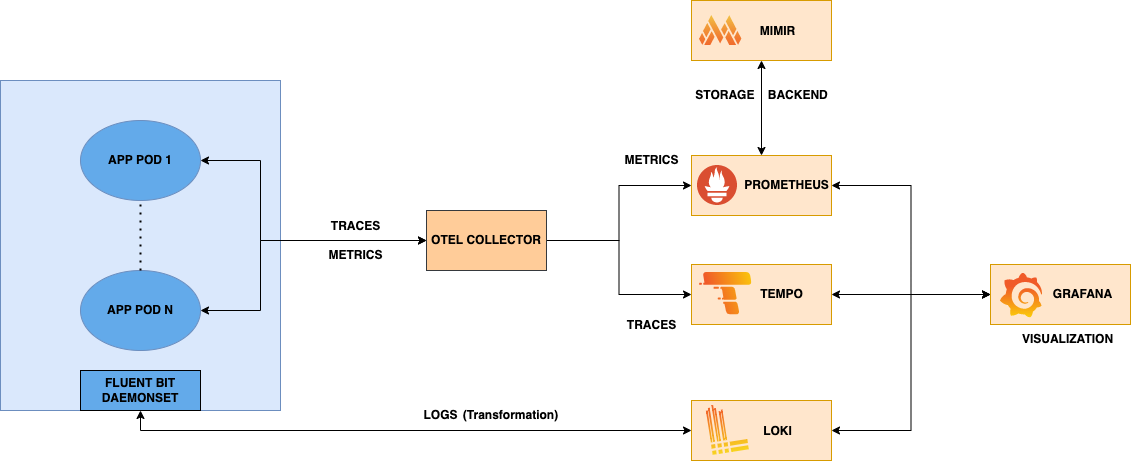
- Both Traces and Metrics are sent to OTEL Collector directly. Tempo is used as tracing backend for traces and Prometheus is used for metrics with Mimir as its backend.
- For Logs, a fluent bit daemonset is running on node, which collects logs from various applications on the node. Loki is used as logs aggregation solution.
13.2 Goals
Auto application performance monitoring
No code APM across microservices, integrable with standard APM tools and logging backends, without any dev effort.
Backend agnostic
Numerous open source and commercial softwares for Observability support OpenTelemetry out of the box, allowing one to switch between them if needed.
Complete debuggability
Collect, correlate and debug signals across logs (events), traces and metrics, based on the request id and the attributes defined for the organization. For example, app version, function, DB query, K8s pod, domain, microservice etc.
13.3 Configuration
13.3.1 OTEL exporter endpoint
Specify the IP address of your OTEL collector as env variable. Refer OTEL Exporter for more information.
$ export OTEL_EXPORTER_OTLP_ENDPOINT=<IP of OTEL collector>:4317
For example,
export OTEL_EXPORTER_OTLP_ENDPOINT=http://172.17.0.1:4317
13.3.2 OTEL service name
Specify the service name by which you want to setup observability and set it as env variable.
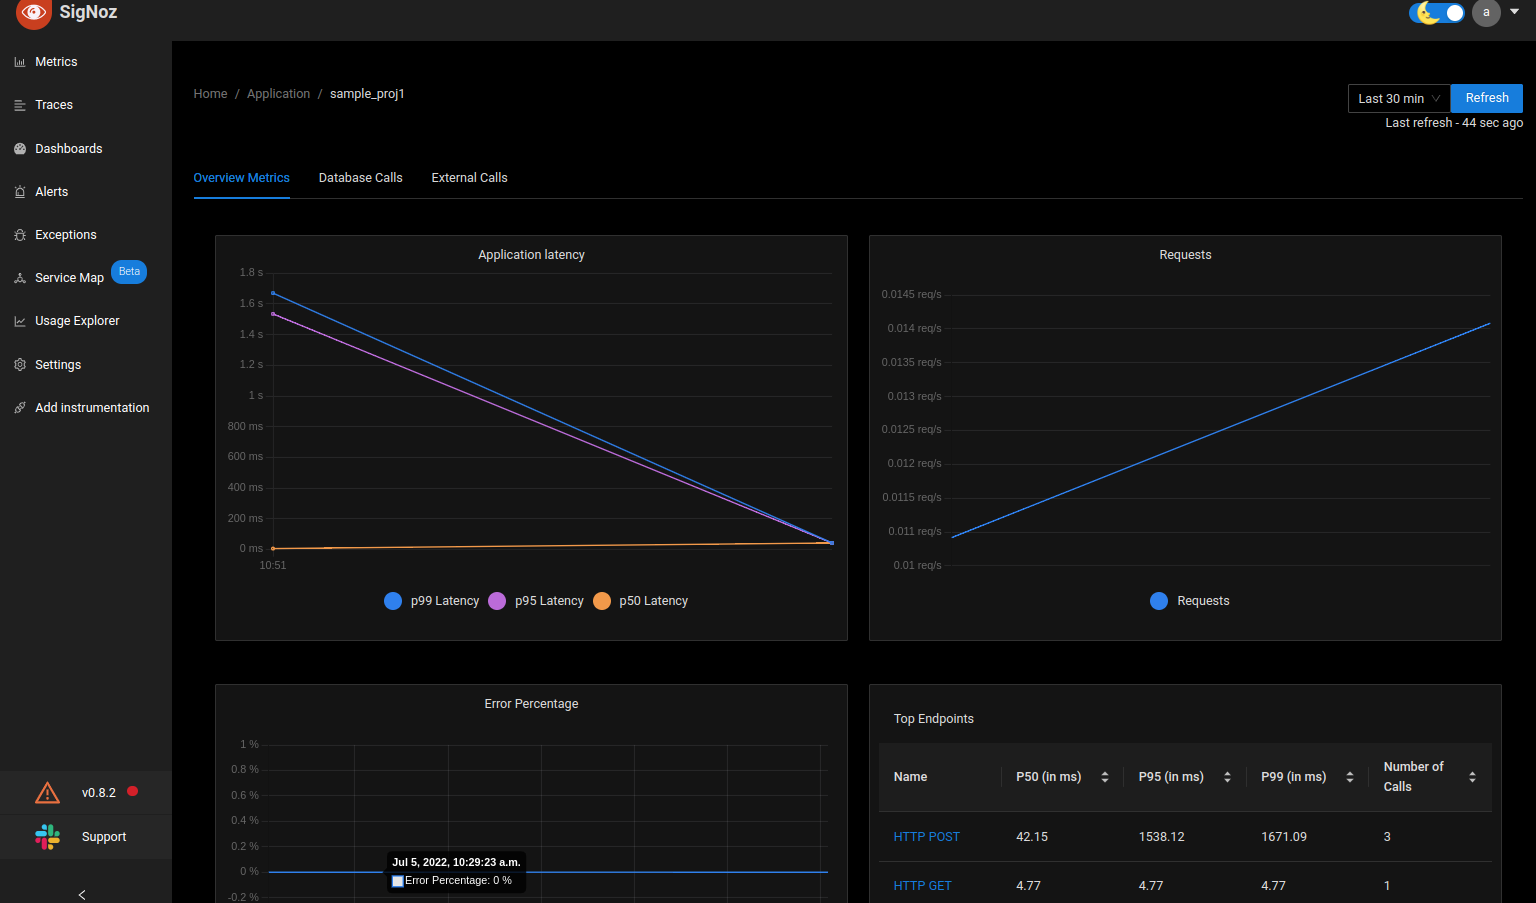
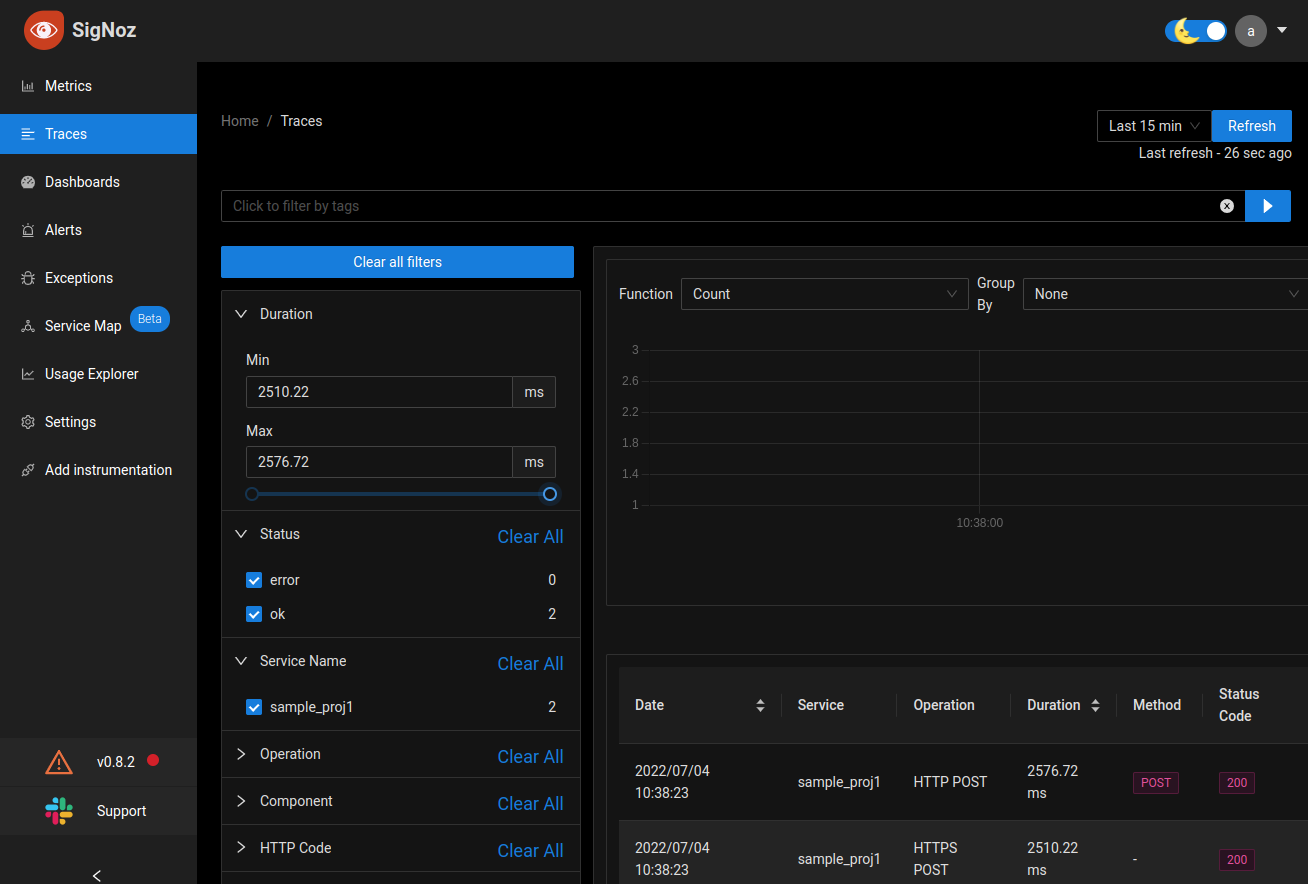
$ export OTEL_SERVICE_NAME=sample_proj1
Let's assume you have setup SigNoz as the exporter then you will see something like this:
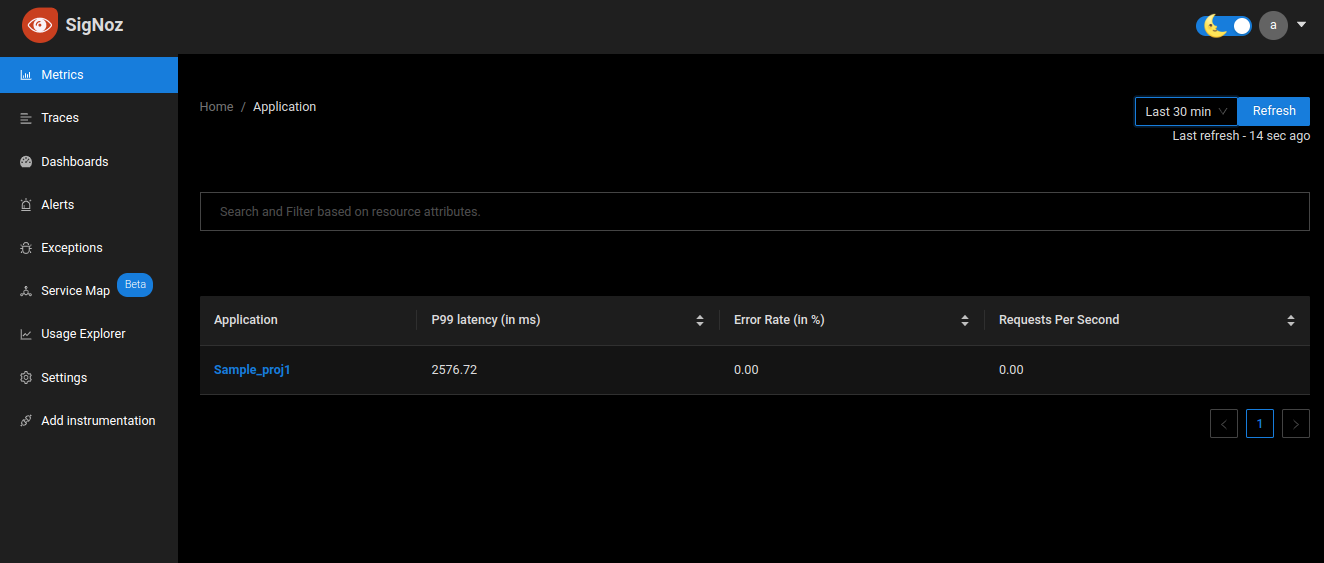
In case you have any questions, please reach out to us on our Discord channel.
13.3.3 Logging
13.3.3.1 Log level
The minimum level set to log above this level. Please refer Pino log levels for more information. Set log_level in Static variables
13.3.3.2 Log fields masking
If you want to hide sensitive information in logs then define the fields which need to be hidden in redact feature in Static variables. Redaction path syntax is standard JSON object lookup.
For example,
redact: ['a.b.c', 'a.b.*', 'req.headers']
By specifying the above redaction paths, the objects which have these properties will be masked in the logs.
Please refer Pino redaction paths for more information.
Generic convention
If you want to mask any field in the objects in all deep nesting levels then you can use **.<field_name> convention instead of specifying each path explicitly.
For example,
redact: ['**.mobileNumber']
By specifying the above redaction path, mobileNumber field will be redacted in logs in all nesting levels.
Sample masked logs:
{"Body":"args after evaluation: step1 {\"name\":\"ABC\",\"gender\":\"M\",\"age\":25,\"mobileNumber\":\"*****\"}","Timestamp":"1684221387896000000","SeverityNumber":9,"SeverityText":"INFO","Resource":{"service.name":"unknown_service:node","host.hostname":"4030f41a75cb","process.pid":3593},"Attributes":{"event":"/helloworld.http.get","workflow_name":"helloworld","task_id":"step1"}}
{"Body":"Executing handler step1 {\"name\":\"ABC\",\"gender\":\"M\",\"age\":25,\"mobileNumber\":\"*****\"}","Timestamp":"1684221387896000000","SeverityNumber":9,"SeverityText":"INFO","Resource":{"service.name":"unknown_service:node","host.hostname":"4030f41a75cb","process.pid":3593},"Attributes":{"event":"/helloworld.http.get","workflow_name":"helloworld","task_id":"step1"}}
{"Body":"Result of _executeFn step1 {\"name\":\"ABC\",\"gender\":\"M\",\"age\":25,\"mobileNumber\":\"*****\"}","Timestamp":"1684221387897000000","SeverityNumber":9,"SeverityText":"INFO","Resource":{"service.name":"unknown_service:node","host.hostname":"4030f41a75cb","process.pid":3593},"Attributes":{"event":"/helloworld.http.get","workflow_name":"helloworld","task_id":"step1"}}
{"Body":"Result of _executeFn add_mobileNumber_transformation_step2 {\"request_data\":{\"payload\":{\"data\":{\"body\":{\"mobileNumber\":\"*****\"}}}}}","Timestamp":"1684221387897000000","SeverityNumber":9,"SeverityText":"INFO","Resource":{"service.name":"unknown_service:node","host.hostname":"4030f41a75cb","process.pid":3593},"Attributes":{"event":"/helloworld.http.get","workflow_name":"helloworld","task_id":"add_mobileNumber_transformation_step2"}}
{"Body":"this.id: hello_world, output: {\"request_data\":{\"payload\":{\"data\":{\"body\":{\"mobileNumber\":\"*****\"}}}}}","Timestamp":"1684221387898000000","SeverityNumber":5,"SeverityText":"DEBUG","Resource":{"service.name":"unknown_service:node","host.hostname":"4030f41a75cb","process.pid":3593},"Attributes":{"event":"/helloworld.http.get","workflow_name":"helloworld","task_id":"hello_world"}}
13.3.3.3 Log format
By default, the logs are dumped in OTEL Logging format when you deploy your service
{"Body":"adding body schema for /upload_doc.http.post","Timestamp":"1676531763727000000","SeverityNumber":9,"SeverityText":"INFO","Resource":{"service.name":"unknown_service:node","host.hostname":"9537a882ae58","process.pid":61741},"Attributes":{}}
{"Body":"adding body schema for /upload_multiple_docs.http.post","Timestamp":"1676531763727000000","SeverityNumber":9,"SeverityText":"INFO","Resource":{"service.name":"unknown_service:node","host.hostname":"9537a882ae58","process.pid":61741},"Attributes":{}}
{"Body":"adding body schema for /upload_s3.http.post","Timestamp":"1676531763727000000","SeverityNumber":9,"SeverityText":"INFO","Resource":{"service.name":"unknown_service:node","host.hostname":"9537a882ae58","process.pid":61741},"Attributes":{}}
{"Body":"registering http handler /another_workflow post","Timestamp":"1676531763727000000","SeverityNumber":9,"SeverityText":"INFO","Resource":{"service.name":"unknown_service:node","host.hostname":"9537a882ae58","process.pid":61741},"Attributes":{}}
{"Body":"registering http handler /create/:entity_type post","Timestamp":"1676531763728000000","SeverityNumber":9,"SeverityText":"INFO","Resource":{"service.name":"unknown_service:node","host.hostname":"9537a882ae58","process.pid":61741},"Attributes":{}}
. . . . . . . . . . .
{"Body":"args.retry {\"max_attempts\":3,\"type\":\"constant\",\"interval\":5000}","Timestamp":"1676531764656000000","SeverityNumber":9,"SeverityText":"INFO","TraceId":"a58ef2d7ff7725c39f1e058bf22fe724","SpanId":"751bc314bb6286b4","TraceFlags":"01","Resource":{"service.name":"unknown_service:node","host.hostname":"9537a882ae58","process.pid":61741},"Attributes":{"event":"/test/:id.http.post","workflow_name":"com.jfs.test","task_id":"test_step1"}}
{"Body":"Result of _executeFn test_step1 {\"success\":true,\"code\":200,\"data\":{\"args\":{},\"data\":\"{\\\"data\\\":{\\\"lan\\\":\\\"12345\\\"}}\",\"files\":{},\"form\":{},\"headers\":{\"Accept\":\"application/json, text/plain, */*\",\"Content-Length\":\"24\",\"Content-Type\":\"application/json\",\"Host\":\"httpbin.org\",\"Traceparent\":\"00-a58ef2d7ff7725c39f1e058bf22fe724-2f13e28430d61bdb-01\",\"User-Agent\":\"axios/0.25.0\",\"X-Amzn-Trace-Id\":\"Root=1-63edd835-22cff8e60555fa522c8544cf\"},\"json\":{\"data\":{\"lan\":\"12345\"}},\"method\":\"POST\",\"origin\":\"180.188.224.177\",\"url\":\"https://httpbin.org/anything\"},\"message\":\"OK\",\"headers\":{\"date\":\"Thu, 16 Feb 2023 07:16:05 GMT\",\"content-type\":\"application/json\",\"content-length\":\"598\",\"connection\":\"close\",\"server\":\"gunicorn/19.9.0\",\"access-control-allow-origin\":\"*\",\"access-control-allow-credentials\":\"true\"}}","Timestamp":"1676531765810000000","SeverityNumber":9,"SeverityText":"INFO","TraceId":"a58ef2d7ff7725c39f1e058bf22fe724","SpanId":"751bc314bb6286b4","TraceFlags":"01","Resource":{"service.name":"unknown_service:node","host.hostname":"9537a882ae58","process.pid":61741},"Attributes":{"event":"/test/:id.http.post","workflow_name":"com.jfs.test","task_id":"test_step1"}}
{"Body":"Validate Response JSON Schema Success","Timestamp":"1676531765811000000","SeverityNumber":9,"SeverityText":"INFO","TraceId":"a58ef2d7ff7725c39f1e058bf22fe724","SpanId":"751bc314bb6286b4","TraceFlags":"01","Resource":{"service.name":"unknown_service:node","host.hostname":"9537a882ae58","process.pid":61741},"Attributes":{"event":"/test/:id.http.post","workflow_name":"com.jfs.test","task_id":""}}
Dev Format
The dev format is basically a transformation of OTEL log format to increase readability for developers. To set the dev format logs, you need to set NODE_ENV value as dev inside your environment.
export NODE_ENV=dev
The format is as below:
datetime [SeverityText] TraceId SpanId {Attributes} Body
Sample Logs:
16/02/23, 12:44:42 pm [INFO]   {} adding body schema for /upload_doc.http.post
16/02/23, 12:44:42 pm [INFO]   {} adding body schema for /upload_multiple_docs.http.post
16/02/23, 12:44:42 pm [INFO]   {} adding body schema for /upload_s3.http.post
16/02/23, 12:44:42 pm [INFO]   {} registering http handler /another_workflow post
16/02/23, 12:44:42 pm [INFO]   {} registering http handler /create/:entity_type post
16/02/23, 12:44:42 pm [INFO]   {} registering http handler /document post
16/02/23, 12:44:42 pm [INFO]   {} registering http handler /fn_script post
. . . . . . . . . .
16/02/23, 12:44:43 pm [INFO] f9f61d4940e3a8e5be8bc80faf6e36a2 96e746f5cbbee1ac {"event":"/test/:id.http.post","workflow_name":"com.jfs.test","task_id":"test_step1"} args.retry {"max_attempts":3,"type":"constant","interval":5000}
16/02/23, 12:44:44 pm [INFO] f9f61d4940e3a8e5be8bc80faf6e36a2 96e746f5cbbee1ac {"event":"/test/:id.http.post","workflow_name":"com.jfs.test","task_id":"test_step1"} Result of _executeFn test_step1 {"success":true,"code":200,"data":{"args":{},"data":"{\"data\":{\"lan\":\"12345\"}}","files":{},"form":{},"headers":{"Accept":"application/json, text/plain, */*","Content-Length":"24","Content-Type":"application/json","Host":"httpbin.org","Traceparent":"00-f9f61d4940e3a8e5be8bc80faf6e36a2-f6c0a5ce67f5b07c-01","User-Agent":"axios/0.25.0","X-Amzn-Trace-Id":"Root=1-63edd7e4-0b8b6ba319833492520e6b0c"},"json":{"data":{"lan":"12345"}},"method":"POST","origin":"180.188.224.177","url":"https://httpbin.org/anything"},"message":"OK","headers":{"date":"Thu, 16 Feb 2023 07:14:44 GMT","content-type":"application/json","content-length":"598","connection":"close","server":"gunicorn/19.9.0","access-control-allow-origin":"*","access-control-allow-credentials":"true"}}
16/02/23, 12:44:44 pm [INFO] f9f61d4940e3a8e5be8bc80faf6e36a2 96e746f5cbbee1ac {"event":"/test/:id.http.post","workflow_name":"com.jfs.test","task_id":""} Validate Response JSON Schema Success
If you set any other value in NODE_ENV then the logs are dumped in OTEL format by default.
13.3.3.4 Loggin for events
You can add any custom attribute in the OTEL logs whenever any event is triggered on your service. The value for the custom identifier will be picked up from event body, params, query, or headers.
13.3.3.4.1 Custom log attributes for all events
To enable this feature for common logging attributes across all events ,you need to specify two things:
log_attributesvariable as environment variable or static variable which contains custom identifiers.
For example, this is the sample static configuration:
log_attributes:
  mobileNumber: "query?.mobileNumber"
  id: "params?.id"
  lan: "body?.data?.lan"
  name: "headers?.name"
  gender: <% mappings.Gender %>
- location of the identifier in the request payload. As specified in the above example,
- if mobileNumber is present in query params then specify
query?.mobileNumber. - if id is present in path params then specify
params?.id. - if lan is present in data field inside body then specify
body?.data?.lan. - if name is present in headers then specify
headers?.name. - if gender is present in data field inside mappings then specify
<% mappings.Gender %>.
- if mobileNumber is present in query params then specify
Please make sure to add ? in case any field is optional like body?.data?.lan so that it works well with undefined values. This will add lan in the logs if it is present else it will not get added.
Sample Logs
- Dev format
21/02/23, 11:54:06 am [INFO] 48c894ed7d65caa236e8cc0664ee4e5e 5af2d3d564e86fb6 {"event":"/test/:id.http.post","workflow_name":"com.jfs.test","mobileNumber":"9878987898","id":"12","lan":"12345"} Processing event /test/:id.http.post
21/02/23, 11:54:06 am [INFO] 48c894ed7d65caa236e8cc0664ee4e5e 5af2d3d564e86fb6 {"event":"/test/:id.http.post","workflow_name":"com.jfs.test","mobileNumber":"9878987898","id":"12","lan":"12345"} event inputs {"baseUrl":"","body":{"data":{"lan":"12345"}},"fresh":false,"hostname":"localhost","ip":"::ffff:172.22.0.1","ips":[],"method":"POST","originalUrl":"/test/12?mobileNumber=9878987898","params":{"id":"12"},"path":"/test/12","protocol":"http","query":{"mobileNumber":"9878987898"},"route":{"path":"/test/:id","stack":[{"name":"<anonymous>","keys":[],"regexp":{"fast_star":false,"fast_slash":false},"method":"post"},{"name":"<anonymous>","keys":[],"regexp":{"fast_star":false,"fast_slash":false},"method":"post"}],"methods":{"post":true}},"secure":false,"stale":true,"subdomains":[],"xhr":false,"headers":{"content-type":"application/json","user-agent":"PostmanRuntime/7.29.2","accept":"*/*","postman-token":"835edd29-7c36-4e11-9b79-c661bbd911b0","host":"localhost:4000","accept-encoding":"gzip, deflate, br","connection":"keep-alive","content-length":"46"},"files":[]}
21/02/23, 11:54:06 am [INFO] 48c894ed7d65caa236e8cc0664ee4e5e 5af2d3d564e86fb6 {"event":"/test/:id.http.post","workflow_name":"com.jfs.test","mobileNumber":"9878987898","id":"12","lan":"12345"} event body and eventSpec exist
- OTEL format
{"Body":"Processing event /test/:id.http.post","Timestamp":"1676960742403000000","SeverityNumber":9,"SeverityText":"INFO","TraceId":"3b66e6f8ec6624f6467af1226503a39e","SpanId":"eb6e7d89ac381e9f","TraceFlags":"01","Resource":{"service.name":"unknown_service:node","host.hostname":"5252603e08be","process.pid":828},"Attributes":{"event":"/test/:id.http.post","workflow_name":"com.jfs.test","mobileNumber":"9878987898","id":"12","lan":"12345"}}
{"Body":"event inputs {\"baseUrl\":\"\",\"body\":{\"data\":{\"lan\":\"12345\"}},\"fresh\":false,\"hostname\":\"localhost\",\"ip\":\"::ffff:172.22.0.1\",\"ips\":[],\"method\":\"POST\",\"originalUrl\":\"/test/12?mobileNumber=9878987898\",\"params\":{\"id\":\"12\"},\"path\":\"/test/12\",\"protocol\":\"http\",\"query\":{\"mobileNumber\":\"9878987898\"},\"route\":{\"path\":\"/test/:id\",\"stack\":[{\"name\":\"<anonymous>\",\"keys\":[],\"regexp\":{\"fast_star\":false,\"fast_slash\":false},\"method\":\"post\"},{\"name\":\"<anonymous>\",\"keys\":[],\"regexp\":{\"fast_star\":false,\"fast_slash\":false},\"method\":\"post\"}],\"methods\":{\"post\":true}},\"secure\":false,\"stale\":true,\"subdomains\":[],\"xhr\":false,\"headers\":{\"content-type\":\"application/json\",\"user-agent\":\"PostmanRuntime/7.29.2\",\"accept\":\"*/*\",\"postman-token\":\"9e57df7d-0a75-48b6-bc52-921bd5c045b7\",\"host\":\"localhost:4000\",\"accept-encoding\":\"gzip, deflate, br\",\"connection\":\"keep-alive\",\"content-length\":\"46\"},\"files\":[]}","Timestamp":"1676960742403000000","SeverityNumber":9,"SeverityText":"INFO","TraceId":"3b66e6f8ec6624f6467af1226503a39e","SpanId":"eb6e7d89ac381e9f","TraceFlags":"01","Resource":{"service.name":"unknown_service:node","host.hostname":"5252603e08be","process.pid":828},"Attributes":{"event":"/test/:id.http.post","workflow_name":"com.jfs.test","mobileNumber":"9878987898","id":"12","lan":"12345"}}
{"Body":"event body and eventSpec exist","Timestamp":"1676960742404000000","SeverityNumber":9,"SeverityText":"INFO","TraceId":"3b66e6f8ec6624f6467af1226503a39e","SpanId":"eb6e7d89ac381e9f","TraceFlags":"01","Resource":{"service.name":"unknown_service:node","host.hostname":"5252603e08be","process.pid":828},"Attributes":{"event":"/test/:id.http.post","workflow_name":"com.jfs.test","mobileNumber":"9878987898","id":"12","lan":"12345"}}
13.3.3.4.2 Custom log attributes at event level
You can override log attributes at event level also. You can specify customized log attributes for specific event.
This will override default custom attributes as defined above 13.3.3.4.1.
To enable this feature ,you need to specify:
log_attributeson event level which contains custom identifiers
For example, this is the sample static configuration:
log_attributes:
  msgparameter:
    fruit: apple
  identifier: 1
Sample Logs
- OTEL Format
{ Body: "return value [] 200 %o"
    Timestamp: "1688565778237000000"
    SeverityNumber: 9
    SeverityText: "INFO"
    TraceId: "3fba9b9bd5d10d00b1b730b74c8eba51"
    SpanId: "985e8a8d6a18568b"
    TraceFlags: "01"
    Resource: {
      "service.name": "unknown_service:node",
      "host.hostname": "6295f63d9181",
      "process.pid": 13956
    }
    Attributes: {
      "event": "/postgres/user/search.http.post",
      "workflow_name": "com.biz.postgres.user.search",
      "file_name": "com.biz.postgres.user.search",
      "msgparameter": {
        "fruit": "apple"
      },
      "identifier": 1,
      "task_id": ""
    }}
13.3.3.4.3 Custom on_error logging in workflow/tasks
In case you want to log specific attributes when an error happens in a task, set those values in on_error.log_attributes of that task.
For ex.
summary: add custom error logs on workflow
id: validation_error
tasks:
    - id: error_transform
      fn: com.biz.error_log
on_error:
    log_attributes:
        error_type: "enter your custom error type here"
        error_message: "xyz value is required"
Sample logs
- OTEL format
    {Timestamp: "1688563866502000000"
    SeverityNumber: 17
    SeverityText: "ERROR"
    TraceId: "7563f0bd1e6c6508e58a4d1de1464635"
    SpanId: "c4c65132ef79982f"
    TraceFlags: "01"
    Resource: {
      "service.name": "unknown_service:node",
      "host.hostname": "6295f63d9181",
      "process.pid": 8455
    }
    Attributes: {
      "event": "/postgres/user/search.http.post",
      "workflow_name": "com.biz.postgres.user.search",
      "file_name": "com.biz.postgres.user.search",
      "msgparameter": {
        "fruit": "apple"
      },
      "task_id": "",
      "error": {
        "error_type": "enter your custom error type here",
        "error_message": "xyz value is required"
      }
    }}
13.3.3.4.4 Usage of Logger Instance in Custom JS/TS Functions
This feature enables developers to utilize a Logger Instance in custom JS or TS functions. The Logger Instance assists in logging information, warnings, and errors during the execution of the function. The feature ensures robust logging capabilities and facilitates debugging and monitoring of the application.
Sample code
module.exports = function(args, {childLogger, promClient, tracer}) {
    for (let i = 0; i < 1000; i++) {
        childLogger.error("print log i: %s", i);
    }
    return "OK"
}
Function Parameters:
- args: Represents the arguments passed to the custom JS/TS function. Developers can use this parameter to accept input data and perform necessary computations within the function.
- {childLogger, promClient, tracer}: This object contains three properties, which are as follows:
- childLogger: A Logger Instance that developers can use to log messages, errors, and other relevant information during the function's execution.
- promClient: A library that provides a Prometheus client for collecting metrics and exposing them to Prometheus monitoring system.
- tracer: A library used for distributed tracing, which can be beneficial in identifying and resolving issues across microservices.
13.4 Custom metrics, traces and logs (BPM)
Custom metrics, traces and logs can be added in the workflow DSL at each task level then these will be available out of the box along with APM.
13.4.1 DSL spec for custom metrics
refer https://github.com/siimon/prom-client
metrics:
- name: metric_name
  type: counter|gauge|histogram|summary
  labels:
    label1: val1
    label2: val2

  # following functions depending on the metric type and all of them could be scripts, can use inputs/outputs
  inc: 10
  dec: 10
  set: 100
  observe: 2000
  timer: true|false(boolean) starts at the beginning of workflow/task and ends at the end of workflow/task
Example spec
In the following example, we are using two custom metrics:
- httpbin_calls_total: counter type metric, counter is incremented by 1.
- httpbin_calls_duration: histogram type metric, timer is set to true to record duration.
summary: Call an API and transform the
tasks:
    - id: httpbin_step1 # the response of this will be accessible within the parent step key, under the step1 sub key
      name: http bin step
      description: Hit http bin with some dummy data. It will send back same as response
      fn: com.gs.http
      metrics:
        - name: httpbin_calls_total
          help: 'httpbin_calls_total counter of httpbin requests labeled with: method, status_code'
          type: counter
          labels:
            method: httpbin
            status_code: <% outputs.httpbin_step1.code %>
          inc: 1
        - name: httpbin_calls_duration
          help: 'httpbin_calls_duration duration histogram of httpbin responses labeled with: method, status_code'
          type: histogram
          labels:
            method: httpbin
            status_code: <% outputs.httpbin_step1.code %>
          timer: true
      args:
        datasource: httpbin
        params: <% inputs.query %>
        data: <% inputs.body %>
        config:
          url : /anything
          method: post
13.4.2 DSL spec for custom trace
trace:
    name: span_name
    attributes:
        attribute1: value1
        attribute2: value2
Example spec
In the following example, we are creating a new span named httpbin_trace with span attributes request and param. This span gets created when the task starts and ended when the task completes its execution.
summary: Call an API and transform the
tasks:
    - id: httpbin_step1 # the response of this will be accessible within the parent step key, under the step1 sub key
      name: http bin step
      description: Hit http bin with some dummy data. It will send back same as response
      fn: com.gs.http
      trace:
        name: httpbin_trace
        attributes:
            request: <%inputs.body%>
            param: <%inputs.query%>
      args:
        datasource: httpbin
        params: <% inputs.query %>
        data: <% inputs.body %>
        config:
          url : /anything
          method: post
13.4.3 DSL spec for custom logs
If you want generate a log before or after a task.
logs:
    before:
        level: fatal|error|warn|info|debug|trace # refer pino for levels
        message: 'Sample log before'
        params:
          param1: val1
          param2: val2
        attributes:
          request:
            query: <%inputs.query%>
    after:
        level: info
        message: 'Sample log after'
        params:
        attributes:
The logs are dumped in OTEL format. Please refer to OTEL Logging Data model for understanding of fields dumped in the logs.
messageandparamsare part ofBodyfield andattributesare part ofAttributesfield in the log.
Example spec
In the following example, we are two additional logs before and after the task execution.
summary: Call an API and transform the
tasks:
    - id: httpbin_step1 # the response of this will be accessible within the parent step key, under the step1 sub key
      name: http bin step
      description: Hit http bin with some dummy data. It will send back same as response
      fn: com.gs.http
      logs:
        before:
          level: error
          message: 'Hello'
          params:
            - key1: v1
              key2: v2
            - v1
          attributes:
            request: <%inputs.query%>
        after:
          level: error
          message: 'World'
          params:
            key1: v1
            key2: v2
          attributes:
            customer_name: <% outputs.httpbin_step1.data.json.customer_name %>
      args:
        datasource: httpbin
        params: <% inputs.query %>
        data: <% inputs.body %>
        config:
          url : /anything
          method: post
Sample Logs
{"Body":"Hello [{\"key1\":\"v1\",\"key2\":\"v2\"},\"v1\"]","Timestamp":"1676011973016000000","SeverityNumber":9,"SeverityText":"INFO","TraceId":"afde0bf5bb3533d932c1c04c30d91172","SpanId":"ad477b2cf81ca711","TraceFlags":"01","Resource":{"service.name":"unknown_service:node","host.hostname":"9ce06d358ba7","process.pid":67228},"Attributes":{"request":{"status":"Hello"},"task_id":"if","workflow_name":"if_else"}}
. . . . . . . . . . .
{"Body":"World {\"key1\":\"v1\",\"key2\":\"v2\"}","Timestamp":"1676011973019000000","SeverityNumber":17,"SeverityText":"ERROR","TraceId":"afde0bf5bb3533d932c1c04c30d91172","SpanId":"ad477b2cf81ca711","TraceFlags":"01","Resource":{"service.name":"unknown_service:node","host.hostname":"9ce06d358ba7","process.pid":67228},"Attributes":{"customer_name":"Hell!","task_id":"if","workflow_name":"if_else"}}
13.5 Observability Stack
The complete observability stack with K8s helm-charts will be made available soon.
13.6 Recommended model for telemetry signals
Please find the draft documentation here. This is compiled in one place from various references across the OpenTelemetry documentation. This may require works by the DevOps team as well e.g. K8s related attributes.