Observability Architecture
The below architecture diagram explains the implementation of observability in Godspeed.
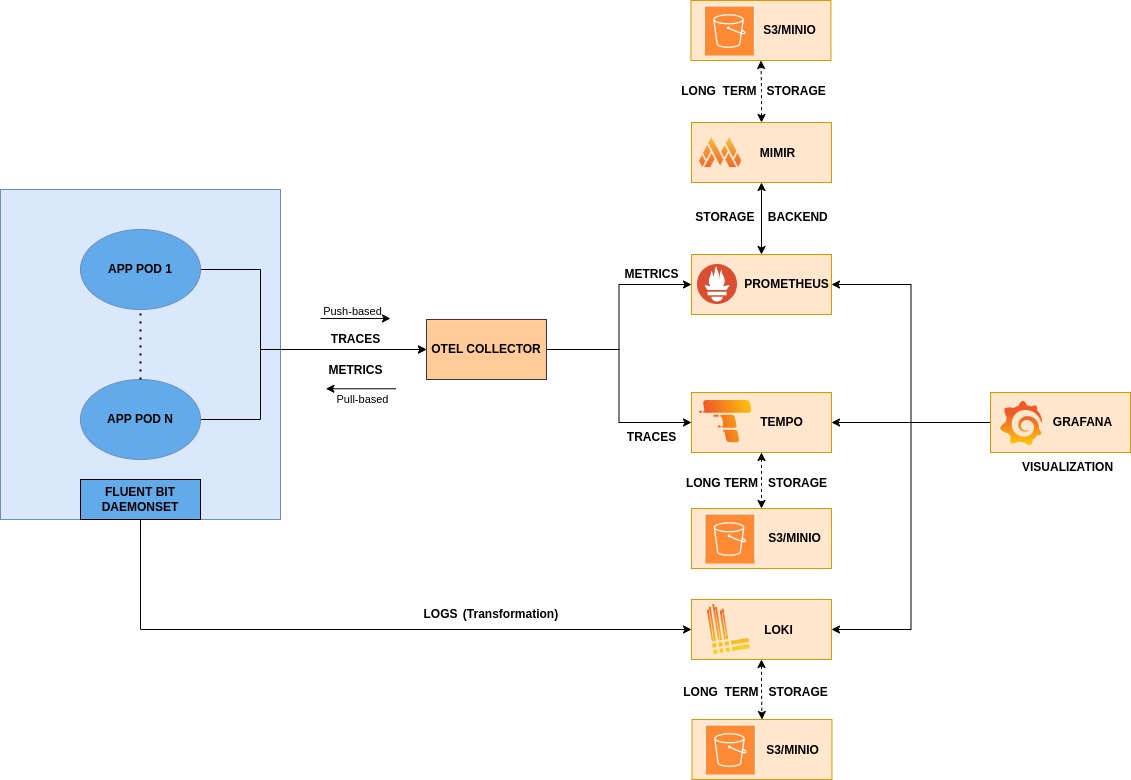
(a) Traces are sent to OTEL Collector directly by the application (push based mechanism) using OTLP/gRPC protocol. Tempo is used as tracing backend for traces.
(b) Metrics are scraped by the OTEL Collector from the application's /metrics endpoint (pull based mechanism). Prometheus is used as a monitoring tool for metrics with Mimir as its backend.
(c) Logs are collected by a fluent bit service. Then it sends the logs to Loki.
(d) Grafana Open Source is used for the visualization of all the telemetry data.